En la documentación de Python GDAL/OGR Cookbook 1.0 existe un procedimiento para crear una ruta de mínimo costo empleando un ráster DEM. Para reutilizar el código me propuse probarlo con mi propio DEM y dos puntos arbitrarios; tal como se presentan en la imagen siguiente:

Cuando hice las sustituciones correspondientes en el código para adaptarlas a mis condiciones y lo ejecuté, éste produjo un error producto de la ausencia del método 'route_through_array' del módulo scikit-image de Python. Después de instalarlo con pip install, el código se ejecutó aparentemente sin problemas pero no produjo ráster resultante. Por esta razón, lo adapté tal como se presenta a continuación incluyéndole, además, la instrucción para establecer como cero los nodata values.
1 2 3 4 5 6 7 8 9 10 11 12 13 14 15 16 17 18 19 20 21 22 23 24 25 26 27 28 29 30 31 32 33 34 35 36 37 38 39 40 41 42 43 44 45 46 47 48 49 50 51 52 53 54 55 56 57 58 59 60 61 62 63 64 65 66 67 68 69 70 71 | import gdal, osr from skimage.graph import route_through_array import numpy as np def raster2array(rasterfn): raster = gdal.Open(rasterfn) band = raster.GetRasterBand(1) array = band.ReadAsArray() return array def coord2pixelOffset(rasterfn,x,y): raster = gdal.Open(rasterfn) geotransform = raster.GetGeoTransform() originX = geotransform[0] originY = geotransform[3] pixelWidth = geotransform[1] pixelHeight = geotransform[5] xOffset = int((x - originX)/pixelWidth) yOffset = int((y - originY)/pixelHeight) return xOffset,yOffset def createPath(CostSurfacefn,costSurfaceArray,startCoord,stopCoord): # coordinates to array index startCoordX = startCoord[0] startCoordY = startCoord[1] startIndexX,startIndexY = coord2pixelOffset(CostSurfacefn,startCoordX,startCoordY) stopCoordX = stopCoord[0] stopCoordY = stopCoord[1] stopIndexX,stopIndexY = coord2pixelOffset(CostSurfacefn,stopCoordX,stopCoordY) # create path indices, weight = route_through_array(costSurfaceArray, (startIndexY,startIndexX), (stopIndexY,stopIndexX),geometric=True,fully_connected=True) indices = np.array(indices).T path = np.zeros_like(costSurfaceArray) path[indices[0], indices[1]] = 1 return path def array2raster(newRasterfn,rasterfn,array): raster = gdal.Open(rasterfn) geotransform = raster.GetGeoTransform() originX = geotransform[0] originY = geotransform[3] pixelWidth = geotransform[1] pixelHeight = geotransform[5] cols = array.shape[1] rows = array.shape[0] driver = gdal.GetDriverByName('GTiff') outRaster = driver.Create(newRasterfn, cols, rows, 1, gdal.GDT_Byte) outRaster.SetGeoTransform((originX, pixelWidth, 0, originY, 0, pixelHeight)) outband = outRaster.GetRasterBand(1) outband.SetNoDataValue(0) #included outband.WriteArray(array) outRasterSRS = osr.SpatialReference() outRasterSRS.ImportFromWkt(raster.GetProjectionRef()) outRaster.SetProjection(outRasterSRS.ExportToWkt()) outband.FlushCache() CostSurfacefn = '/home/zeito/pyqgis_data/utah_demUTM12_clipped.tif' startCoord = (395863.342904, 4436115.96435) stopCoord = (397790.783272, 4434698.72878) outputPathfn = '/home/zeito/pyqgis_data/Path.tif' costSurfaceArray = raster2array(CostSurfacefn) # creates array from cost surface raster pathArray = createPath(CostSurfacefn,costSurfaceArray,startCoord,stopCoord) # creates path array array2raster(outputPathfn,CostSurfacefn,pathArray) # converts path array to raster |
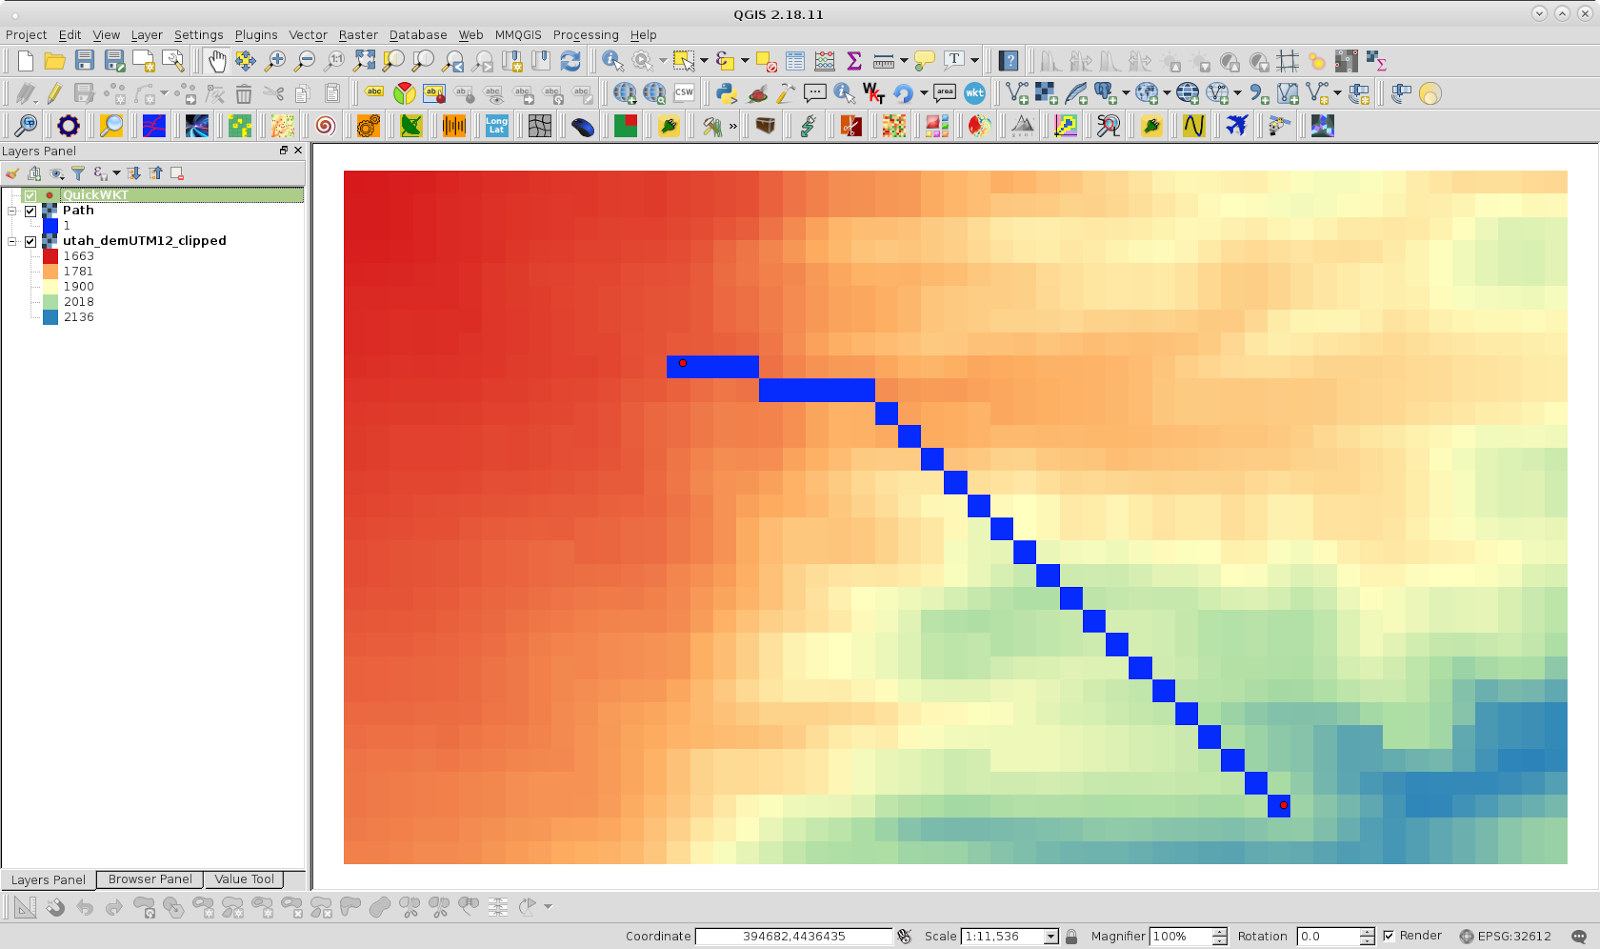
Después de ejecutar el código en la Python Console de QGIS, se cargó el ráster resultante a la Map View y se le colocó el estilo (color azul) que se presenta en la imagen siguiente. El código produjo los resultados deseados con las modificaciones propuestas. Esa es la ruta de mínimo costo entre los dos puntos considerados.
No hay comentarios:
Publicar un comentario